Here in Indianapolis, with 14.5" of snowfall and a avg temp of 35.5°, this made for a 4th snowiest and 14th coolest March on record. It was after a period of 50 days (February 15th-April 5th), the cold pattern finally eased up and allowed temperatures to warm to our first 70° & 80° day of the year on April 6th & 9th respectively. The pattern turned from snowy to rainy, where April finished with 8.59", good for the 2nd wettest April on record. This was 0.01" shy from tying the 1893 total rainfall amount of 8.60", #1 wettest on record for the month. These weather records date as far back as 1871. As spring season sprung, the official last freeze date occurred on April 20th with a low of 30°. April 2013 was ranked as the 74th coolest April out of the past 142 years of record keeping.
The cool and wet April kept farmers from getting into the fields putting them behind by a few weeks. The wait was over when we opened May as the warmest in 6 years. With a high temperature of 81°, this was the 7th time over the past 60 years for May to open with a high temp 80+. It was also the driest open in 5 years. Interesting note on that, only 4 (now 5) times has May opened dry over the past 18 years. On April 28th, farmers had only planted 1% of the corn crop but during the first 2 weeks of May they were hard at work and by May 19th, 64% of the corn crop and 30% of the soybean crop had been planted. Harvesting was 24% above trend. By months end (actually June 2nd), after May finished as the 60th driest and 34th warmest, farmers had planted 94% of the corn crop and 70% soybeans. Corn was 6% above trend and Soybean was 10% above trend. Due to record rain in areas around the state on May 9th, some crops suffered some wind damage. This was also when two tornadoes had touched down in Vigo County.
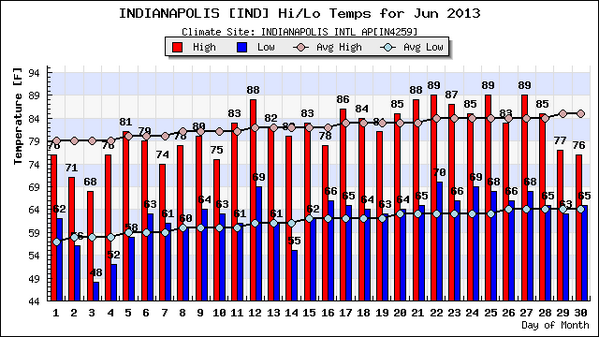
With the passing of a few storm systems and cold fronts, not only did we have the coolest Race Day & Memorial Day weekend in 10 years but we opened up meteorological summer (June 1st) with April-like spring-like temps. The high on June 3rd was 68° after a morning low of 48°. These are averages for April 30th. The cool down did not last long, in fact, we later began to see some of the hottest temps of the year. First it was 88° on the 12th and later again on the 21st. We went up to 89° on the 22nd. This became the hottest day of 2013 but that later occurred again on the 25th & 27th. So far the temperature has not yet reach 90 for the year.
DAYS IN 2013 w/ TEMPS 70+:
DAYS IN 2013 w/ TEMPS 80+:
WARM JUNE ENDS COOL
A month that started cool warmed up rapidly recording 16 days above normal. There was a streak of 12 consecutive days with temps 80+. Not a significant one but noteworthy considering the unseasonably cool start to the year. Summer arrived on cue June 21st. From June 21st-28th, the actual average high was 86.9°. This was 2.5° above normal (84.4°).
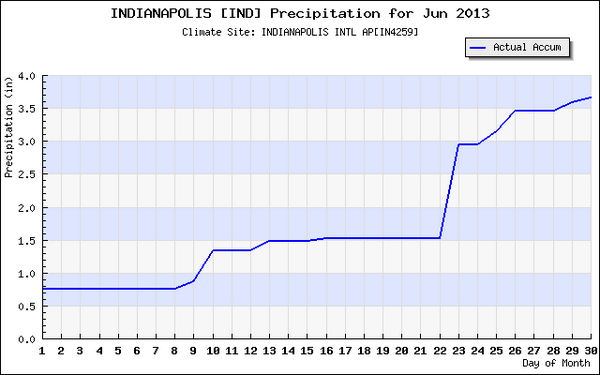
As for rainfall, there was a series of mesoscale convective systems (MCS) throughout the month one that even produced a "Derecho". On June 12th, the Storm Prediction Center (SPC), issued a rare high risk severe weather outlook that encompassed the northern half of Indiana. The last time the "high risk" was issued was back on April 14, 2012 when storm complexes spawned up over 100 tornadoes killing 6 people across the U.S. This time around, the June 12th-13th Derecho series stirred up two dozen tornadoes along with 923 hail & 360 wind reports. Only one derecho impacted our state.
Another storm complex on June 23rd dropped 1.43" in Indianapolis. Like I said, there was numerous storm complexes throughout the month. June 24th, another derecho swept pass Northern Indiana. This lasted over 250 miles from the nations heartland and upper midwest over to the Great Lakes region. The derecho also lasted over six hours and had a consistent swath of severe winds of 58+ mph.
The NWS Northern Indiana has nice summary of these rounds of severe weather on their weather page. You can read it for yourself by either copying and pasting or clicking the following url address below.
JUNE HIGHs
We had 19 days with temperatures 80+, 10 days in the 70s, and 1 did have 1 day with a high the 60s. The 3rd was the coolest day of the month with a high only reaching 68. The average high temperature for the month was 81.2°. This was 0.7° below normal.
TOP FIVE WARMEST DAYS: (1-3) 89° on 22nd, 25th, & 27th (4-5) 88° on the 12th & 21st.
JUNE LOWs
24 days of the month had lows in the 60s and 4 days in the 50s. The 22nd had the warmest low for the month of 70°, while the 3rd had the coolest low for the month of 48°. The average low temperature for the month was 62.7°. This was 0.6° below normal.
JUNE AVERAGE TEMP
If you take all the months highs and lows and average them all together into one temp, you come up with 72°. This is a normal average temperature for June so we did finish above or below normal in the temperature department. It was a mild month where 16 days finished above normal, 10 days finished below normal and 4 days finished normal. Converting that to percentages; 53.4% of June was above normal, 33.3% below normal, and 13.3% normal. June 2013 was ranked as the 71st warmest on record. This was out the past 142 months of June that temperature records are available.

JUNE PRECIP
As I talked about earlier, a series of storm complexes swept through the state. The total precipitation amount was 3.66". This was 0.59" below the normal 4.25". We did receive 1.43" from a storm complex on June 22nd. June 2013 was ranked as the 69th driest.

INDIANAPOLIS IS STILL ABOVE NORMAL FOR THE YEAR IN RAINFALL BY OVER 4"
Here's a look at the current rainfall chart that is valid thru July 2nd.
| LOCATION | YEAR TO DATE PRECIP (thru July 2nd) |
DEPARTURE FROM NORMAL |
PRECIP SINCE JUNE 1 |
DEPARTURE FROM NORMAL |
MONTH TO DATE PRECIP |
DEPARTURE FROM NORMAL |
| BLOOMINGTON | 25.04 | -0.05 | 6.03 | +0.83 | 0.46 | +0.15 |
| EVANSVILLE | 30.36 | +6.08 | 7.81 | +3.77 | 0.26 | 0.00 |
| FT. WAYNE | 24.25 | +5.04 | 6.58 | +2.17 | 0.67 | +0.42 |
| INDIANAPOLIS | 26.49 | +4.52 | 4.66 | +0.09 | 1.00 | +0.68 |
| INDIANAPOLIS EAGLE CREEK |
24.98 | +3.51 | 6.14 | +1.48 | 1.09 | +0.82 |
| LAFAYETTE | 22.89 | +4.51 | 4.27 | -0.09 | TRACE | -0.26 |
| MUNCIE | 21.42 | +0.90 | 5.61 | +0.66 | 0.63 | +0.34 |
| SHELBYVILLE | 17.05 | -5.33 | 4.74 | +0.14 | 0.26 | +0.06 |
| SOUTH BEND | 21.43 | +3.68 | 4.13 | +0.10 | 0.70 | +0.46 |
| TERRE HAUTE | 30.45 | +7.35 | 9.42 | +4.76 | 0.63 | +0.41 |
6 Month Recap
I'm not going to elaborate any further, I've already done some of this at the beginning of the blog. Instead, here's observed monthly averages of previous months this year and how they compare from normal.
| MONTH | AVG TEMP |
TEMP DEPARTURE FROM NORMAL |
TEMP RANKING |
TOTAL PRECIP |
PRECIP DEPARTURE FROM NORMAL |
PRECIP RANKING |
TOTAL SNOWFALL |
SNOWFALL DEPARTURE FROM NORMAL |
SNOWFALL RANKING |
| JANUARY | 29.9° | +1.8° | 58th Warmest | 5.51" | +2.85" | 16th Wettest | 2.4" | -6.2" | 35th least snowiest |
| FEBRUARY | 30.9° | -1.2° | 66th Coolest | 2.27" | -0.05" | 71st Driest | 2.6" | -3.9" | 46th least snowiest |
| MARCH | 35.5° | -6.7° | 14th Coolest | 1.96" | -1.60" | 30th Driest | 14.5" | +11.9" | 4th Snowiest |
| APRIL | 52.5° | -0.5° | 74th Coolest | 8.59" | +4.78" | 2nd Wettest | TRACE | -0.2" | N/A |
| MAY | 65.4° | +2.7° | 34th Warmest | 3.50" | -1.55" | 60th Driest | NONE | 0.00" | N/A |
| JUNE | 72° | 0.0° | 71st Warmest | 3.66" | -0.59" | 69th Driest | NONE | 0.00" | N/A |
| JAN-JUNE | 47.7° | -1.3° | N/A | 25.49 | +3.84" | N/A | 19.5" | +1.6" | N/A |
TROPIC WATCH
Not a lot going on in the Atlantic at the moment usually activity is at its lowest during June and July picking up in August and September. Andrea came in last month which impacted those in Florida and others along the East and Northeast Coast. The storm reached sustained winds at 65 mph, which met the criteria for a Tropical Storm. The storm killed 3 people; 1 was killed from a car accident in Virginia while 2 others were killed from car accidents in New Jersey. Here's a brief history of Andrea as it forms. The following paragraph was taken from Wikipedia

Barry was the 2nd storm to form in the Atlantic last month. It formed June 17th down near the Caribbean Sea, was upgraded to a tropical storm on the 19th, and made landfall in Veracruz, Mexico on the 20th. Sustained winds reached 45 mph. The storm killed 3 people who likely drowned due to flooding from heavy rains.
WEEKLY CROP REPORT
Farmers have planted 100% of the corn and soybean crop, both 100% emerged and both was ahead of pace despite late start. The late start was primarily due to a record setting rainy April. 4% of the corn crop is poor/very poor and 17% fair while 79% is in good or excellent conditions. 5% of the soybean crop is poor/very and 21% fair while 74% is good or excellent. Farmers may replace bad crops.
According to the latest U.S. Department of Agriculture Crop Progress report, Indiana and Ohio are ranked best in production state in the U.S for Corn and Soybean Crops. 82% of Ohio’s corn crop and 78% of Ohio's soybeans was rated good to excellent. Over the past week, only 3 days were suitable for fieldwork in Ohio. There was some corn crop damaged reported in the northeastern part of the State due to high winds and hail. This was in part due to a rainy setup over the past week that has engulfed much of the Ohio Valley including Indiana as well.
Also, winter wheat harvest is underway where weather permits in Indiana; 27% has been harvested compared to 88% last year. 76% of the crop is rated good to excellent, 19% fair, and 5% poor/very poor.
Here's my Crop Progress Chart.
| 2013 | APR 7 | APR 21 | APR 28 | MAY 5 | MAY 12 | MAY 19 | MAY 26 | JUN 2 | JUN 9 | JUN 16 | JUN 23 | JUN 30 | '08-'12 AVG |
| Corn Planted |
N/A | 1% | 1% | 8% | 30% | 64% | 86% | 94% | 98% | 100% | 100% | 100% | N/A |
| Corn Emerged |
N/A | 0% | 0% | 0% | 3% | 20% | 56% | 77% | 90% | 100% | 100% | 100% | N/A |
| Soybean Planted |
N/A | N/A | 0% | 0% | 6% | 30% | 60% | 76% | 87% | 93% | 96% | 100% | 97% |
| Soybean Emerged |
N/A | N/A | 0% | 0% | 0% | 3% | 24% | 48% | 70% | 83% | 90% | 100% | 93% |
JULY AVERAGES
During a normal month of July, thunderstorm development is more numerous and temperatures are much hotter. The downside to the month is the lost of daylight time.
The average high remains at 85 all month long dropping to 84 on the 30th & 31st.
The average low remains at 66 all month long.
The average temperature is at about 75 all month long.
The hottest temperature ever recorded in July was 106° on numerous days. The last occurred on the 22nd of 1936.
The warmest low temperature ever recorded in July was 84° on the 7th of 1874.
The coolest high temperature ever recorded in July was 64° on the 13th of 1990.
The coolest low temperature ever recorded in July was 46° on numerous days. The last occurred on the 23rd of 1947.
TOP FIVE WARMEST JULY's
(1) 2012-84°
(2) 1936-82.8°
(3) 2011-82°
(4) 1901-81.9°
(5) 1934-81.6°
TOP FIVE COOLEST JULY's
(1) 1947-70.6°
(2) 2009-70.9°
(3) 1960-71.6°
(4) 1891-71.9°
(5) 1882-72.1°
The average precipitation amount for July is 4.55".
The wettest July was 13.12" in 1895, while the driest was 2011 with 0.47".
The wettest day in July is held by the 1st of 1987 with 5.09".
We lose 40 mins of daylight this month.
INDY HAS BEEN ROBBED OF SUMMER
The summer season has arrived...or has it? We had a nice little stint of heat going to kick of the first week of summer but the pattern made a 180° turn. We went from a high of 85° on the 28th to 77° on the 29th. The last day of June, the high was 76! Then we opened July as the coolest in 4 years with a high of 72 and with 0.46" of rain, it was the wettest open in 12 years as well. On July 2nd, we picked up an additional 0.54" of rain. The high went down as 78.
Those rain systems that has been with us for the past week and half has been a product of a slow moving upper level low pressure system. Now 10 out of the past 11 days has either seen a trace or measurable amount of rainfall totaling 3.14" since June 22nd. Don't fret, the low is expected to back off and we may get a few dry days allowing for warmer temperatures to return.
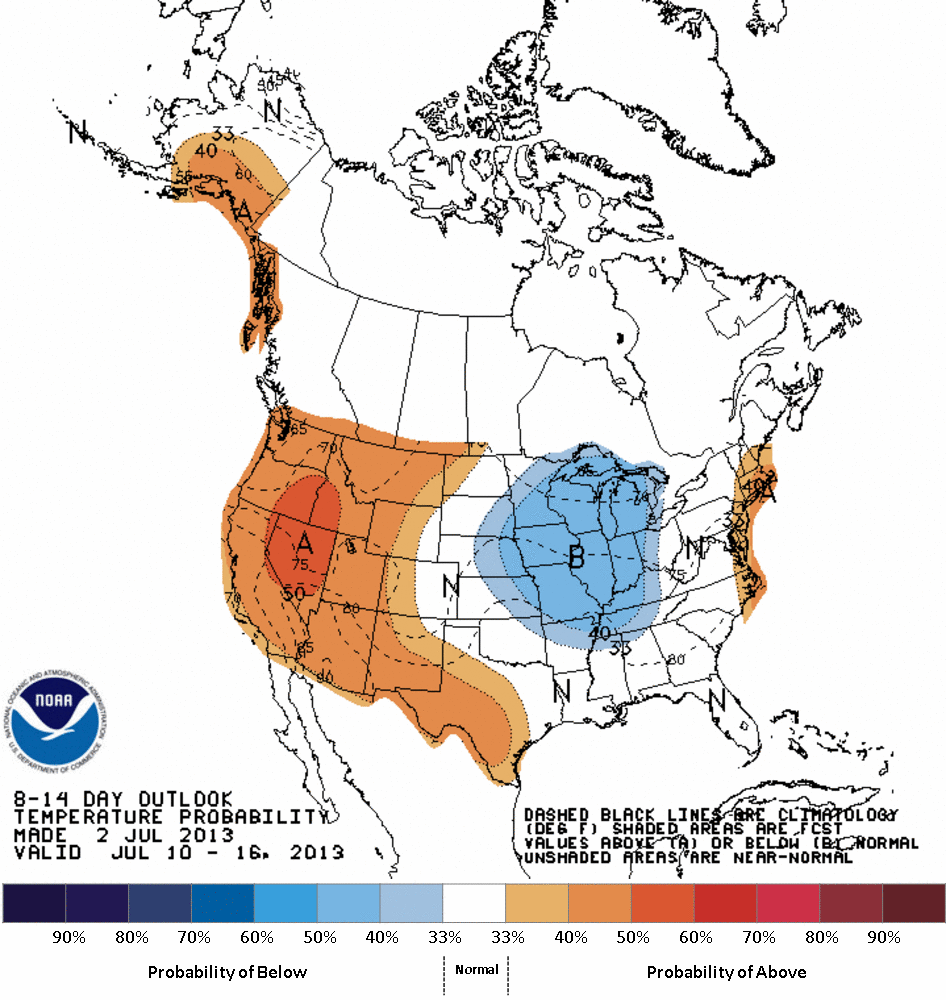
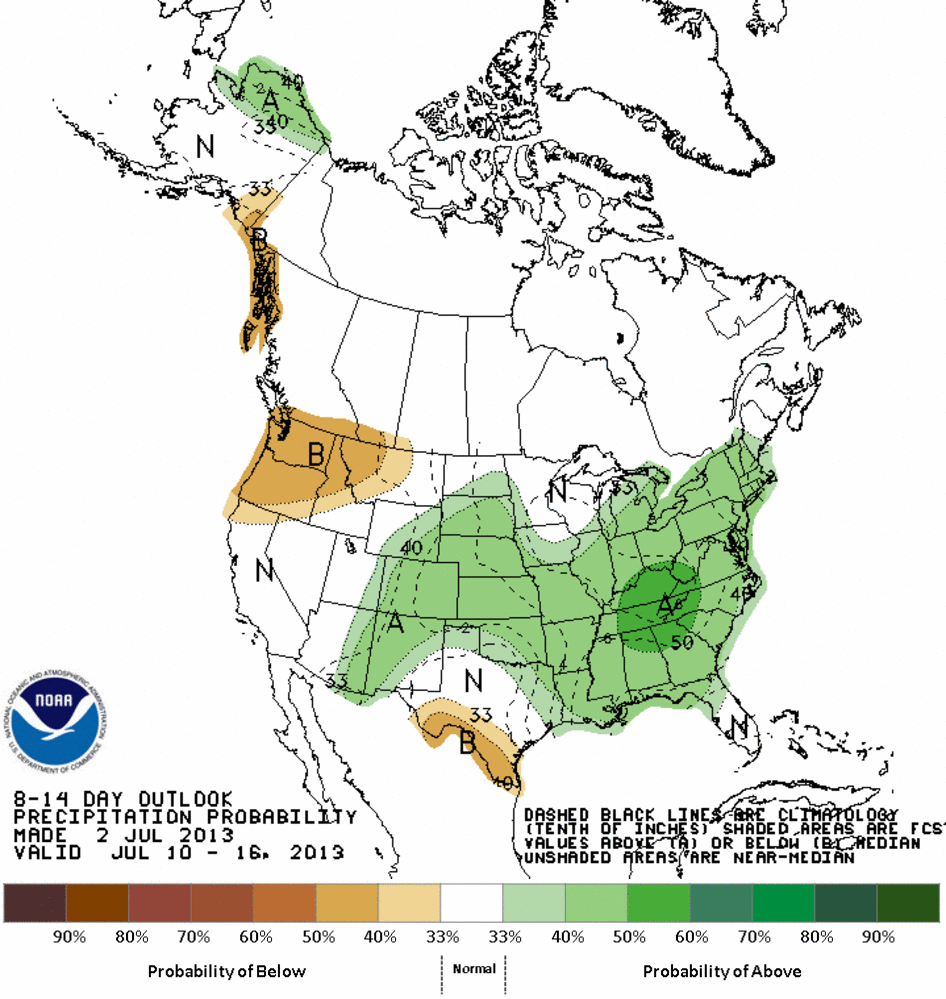
Don't be fooled though folks! A trough will be with us for a good part of the month while a ridge of high pressure will dominate those in the West where the summer heat will lie. We'll continue to have more rainy days and cool temperatures. I'll be blunt, don't expect temperatures to reach the 90s this year. We should have already hit our 1st 90 of the year (avg first date is June 19th) and over the past 10-15 years Independence Day usually marks the latest first 90. Last year was no problem, we had already recorded 90° days 16 times along with 2 triple digit readings. We knew it was only a matter of time before the shoe dropped. We really saw the pattern change back in September 2012. 20 out of past 30 months (since January 2011) have been above normal but 6 out of the past 9 months have been below normal. There could be signs that this cool and wet spell we've been in for much of the year may ease up. Will we get have a mild end to summer? Will we dry up some? Will Fall finish with above normal temperatures and below normal precipitation? Watching the pattern closely. Only a matter of time before I answer these questions with a "yes" or "no".
In the meantime, here's a look at CPC's 6-10 & 8-14 Day Temperature and Precipitation Outlooks
 |
 |
 |
 |
What does "Dog Days of Summer Mean?
The term "Dog Days of Summer" goes back to ancient days when the brightest of the stars in Canis Major (the big dog) was Sirius and also happens to be the brightest star in the night sky. In fact, since its so bright, ancient Romans thought that the earth received heat from it. The "Dog Star" rises and sets with the sun in the summer. It was only fitting that since what they believed this was added heat to the heat of the sun, they would name this hot, sultry period of weather as the "Dog Days of Summer". For a more complete history behind the name visit http://www.theastrologypage.com/Archives/dogdays.htm
|
|
TODAY
The morning fog has burned off. There is an area of low pressure spinning to our West which we'll keep a threat for more rain and storms today especially in western parts of Indiana. I will note though, coverage will be at its lowest today than it has in the past few days. Most will be Partly Cloudy and Mild, this means expect to see more sun and warmer temperatures and likely dry for most. Temperatures will definitely reach upper 70s but most may end up getting into the lower 80s. Also, you may notice it'll feel a little humid out there. Dew Points are expected to be in the mid 60s. With instability & moisture, these would favor the formation of afternoon storms after reaching peak heating of the day. Something meteorologists call "instability storms." These storms are very selective as to where they get going and also dependent on where the most energy will lie.

TONIGHT
Again, partly cloudy with a slight chance of a shower or isolated thunderstorms but most just may stay dry. Lows will be in the low to mid 60s.
TOMORROW
Here's a look at my 4th of July forecast and a look at a few stats. The observed highs over the past 5 years are as follows:
2012-102° (2nd hottest Independence Day on Record)
2011-85°
2010-91°
2009-70° (Coolest Independence Day on Record)
2008-71° ( 2nd Coolest Independence Day on Record)

Here's a look at jet stream winds now (Image #1) and then again 10 days out (Image #2). I talked about it earlier the trough we are in really sticks around for much of the month. It won't be as deep so temperatures likely will not be in the low to mid 70s, however, temperatures will continue to be below normal (85) for a good chunk of the month. A good range between 75-85 for highs.
 |
 |
Here's a look at the Total Precipitation Forecast off this morning's American GFS run going out 2.5 weeks to the July 19th. Numbers are coming out to 3"-6" across the state. Not everyone may see these higher numbers but what areas that do get under the right thunderstorm, could easily be within this range. Again, like I stated earlier in the blog, we'll keep the rain and thus, keep the cooler temperatures.

THURSDAY'S AVG HIGH: 85° | THURSDAY'S AVG LOW: 66°| SUNRISE: 6:23AM | SUNSET: 9:16PM
IT MAY BE SUMMER BUT INDY IS STUCK IN SPRING | DAYS UNTIL AUTUMNAL (FALL) EQUINOX: 81
DOG DAYS OF SUMMER (TYPICALLY HOTTEST PERIOD OF THE YEAR) RUNS FROM JULY 3rd TO AUGUST 11th


No comments:
Post a Comment